Since there isn’t a way to debug SSJS (yet) I mostly resorted to using the print() statement throughout my code. One big disadvantage of this is that all statements are written to the server console. When developing with a team this can get messy (and won’t make your administrators happy), so I looked for a different way to output debug messages. I already use OpenLog to log information to a database, but find it annoying to switch everytime between Designer client, Notes client and browser.
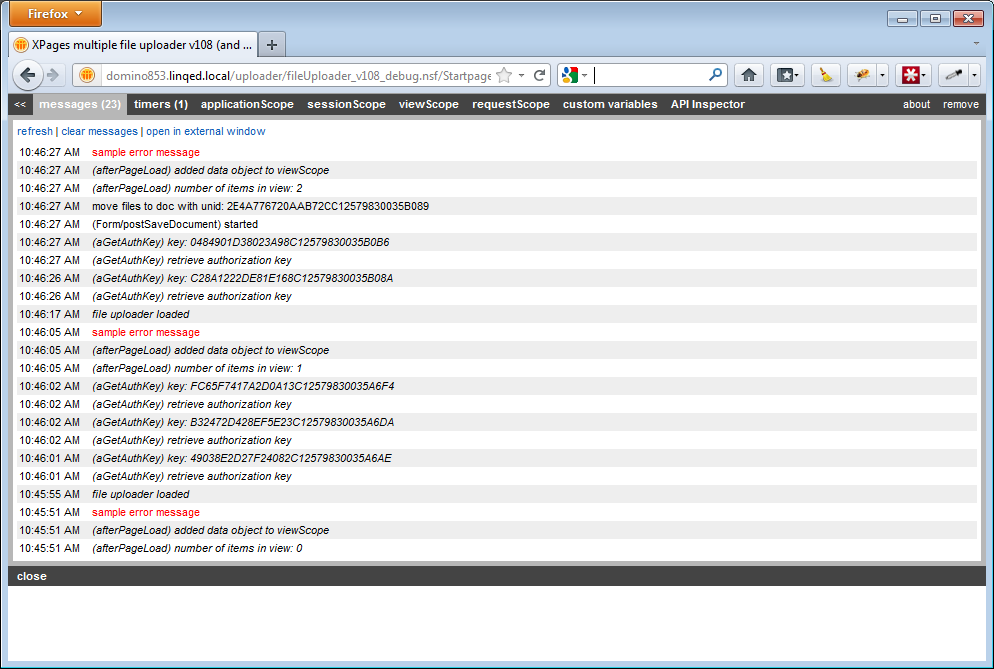
So I created the XPage Debug Toolbar: a toolbar that can be added on top of every XPage and that shows the log/ debug messages written to it. The messages are stored in the sessionScope, so they are unique to the current user and are stored when switching between pages. In the message tab you’ll also notice a “open in external window” link: this will open a seperate XPage (“debugToolbarConsole”) that you can leave open and that will automatically be refreshed showing the latest messages.

Messages can be added to the list using the following commands. The difference is in color coding. The “context” parameter is optional.
dBar.info(message:String, context:String);
dBar.error(message:String, context:String);
dBar.debug(message:String, context:String);
dBar.warn(message:String, context:String);
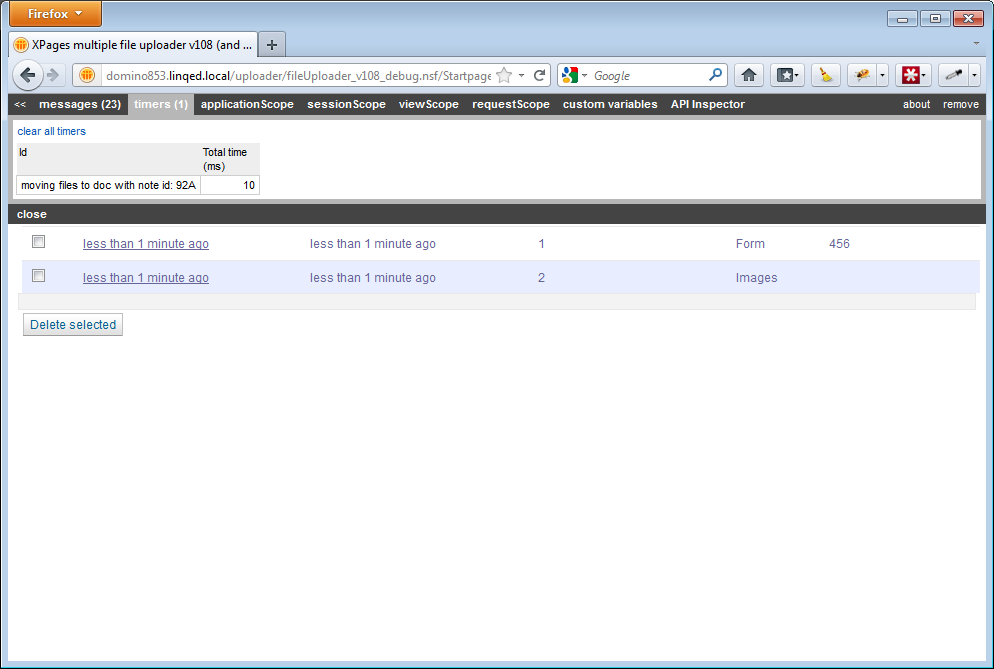
Basic profiling using timers
I also added a “timers” tab to perform some basic profiling tasks on your code. You can add/ start and stop a timer by using the following commands:
dBar.startTimer( timerId:String );
dBar.stopTimer( timerId:String );
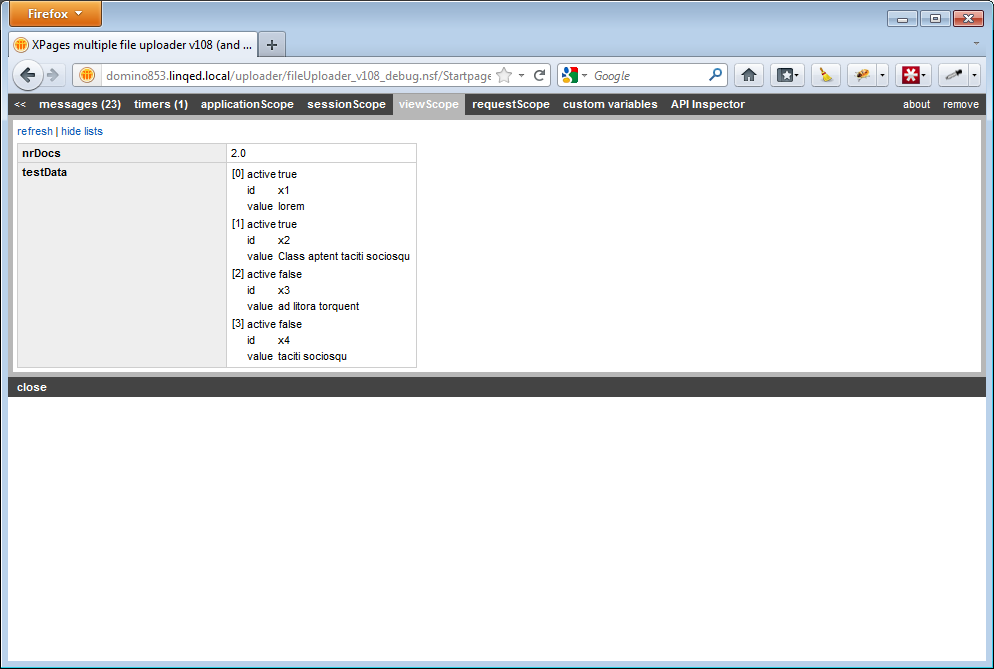
I extended the toolbar with stuff I also use regularly: lists of the contents of the various scopes (application, session, request, view), a list of variables always handy to have around, and Tommy Valand’s API inspector. Inspiration for this came from Ferry Kranenburg’s XPage Debug Custrom Control.
Improved object dumping
All variables from the various scopes are “dumped” in their respective tabs. This is done using a custom dumpObject function I’ve written. In most cases this function dumps more detailed information than the xe:dumpObject control from the Extension Library.
Usage and configuration
Including the toolbar is easy copy the following design elements to the application you’d like to use it in:
- custom control ccDebugToolbar
- (SSJS) script library xpDebugToolbar
- XPage debugToolbarConsole (only required if you want to be able to “detach” the messages tab)
I’d recommend to always include the custom control and use the (custom) “load” property to indicate if it should be loaded or not. If set to false, nothing is rendered, but the xpDebugToolbar script library is included. This way all your log statements will not throw any errors (and won’t do anything). The defaultHidden custom control’s property can be used to set the default state of the toolbar. If hidden, only a small indicator is shown at the top of a page to show the full toolbar. Note that due to the order of events in XPages and custom controls, you can’t add log messages to the beforePageLoad event.
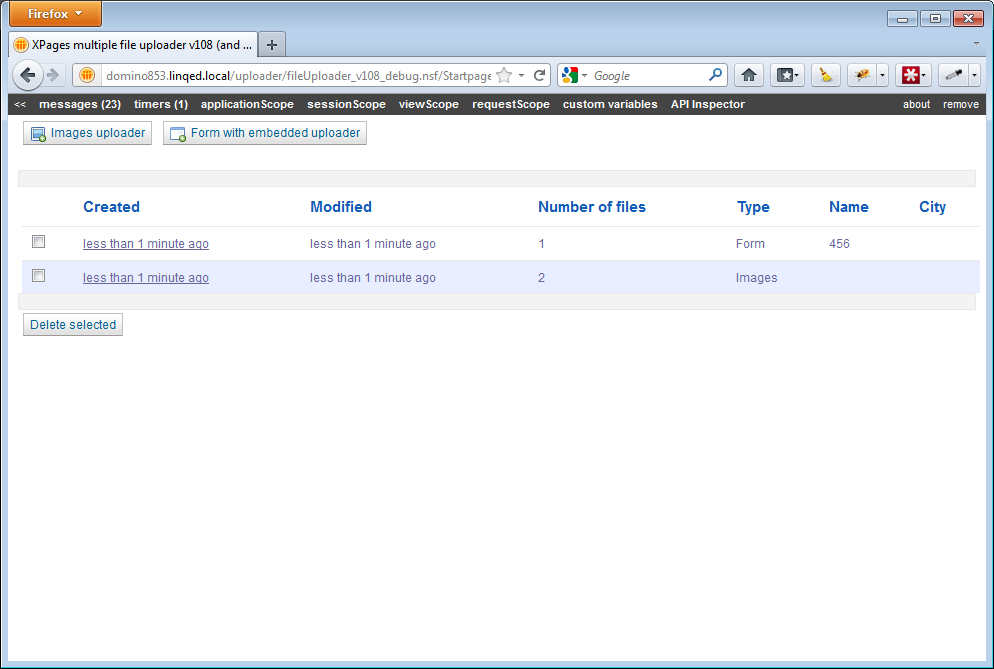
The XPage Debug Toolbar can be downloaded from the project site at OpenNTF. The application features a demo page that shows how to use the toolbar.
Screenshots